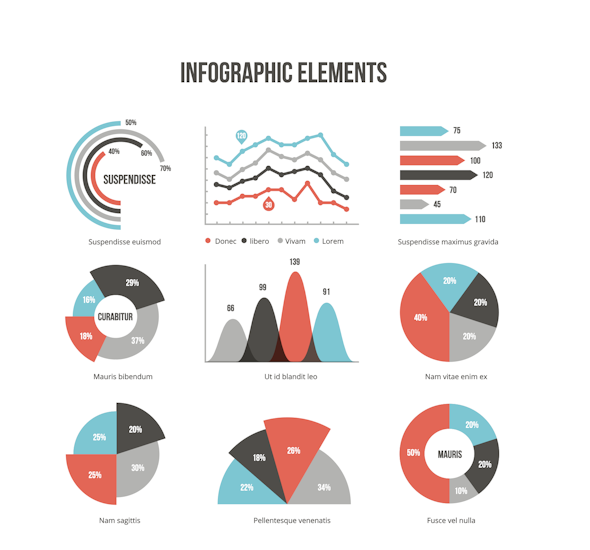
How to create infographic elements with VectorScribe in Illustrator
7 minute readToday we will look at how to create infographic elements using different tools of VectorScribe. The plugin allows you to create Dynamic Graphs, which can easily change the appearance and convert in accordance with the new data. In many cases, it is a faster and more flexible way to create charts, especially if it comes to infographics templates, rather than native Graph Tools.
Create pie charts with Dynamic Shapes Tool
Step 1
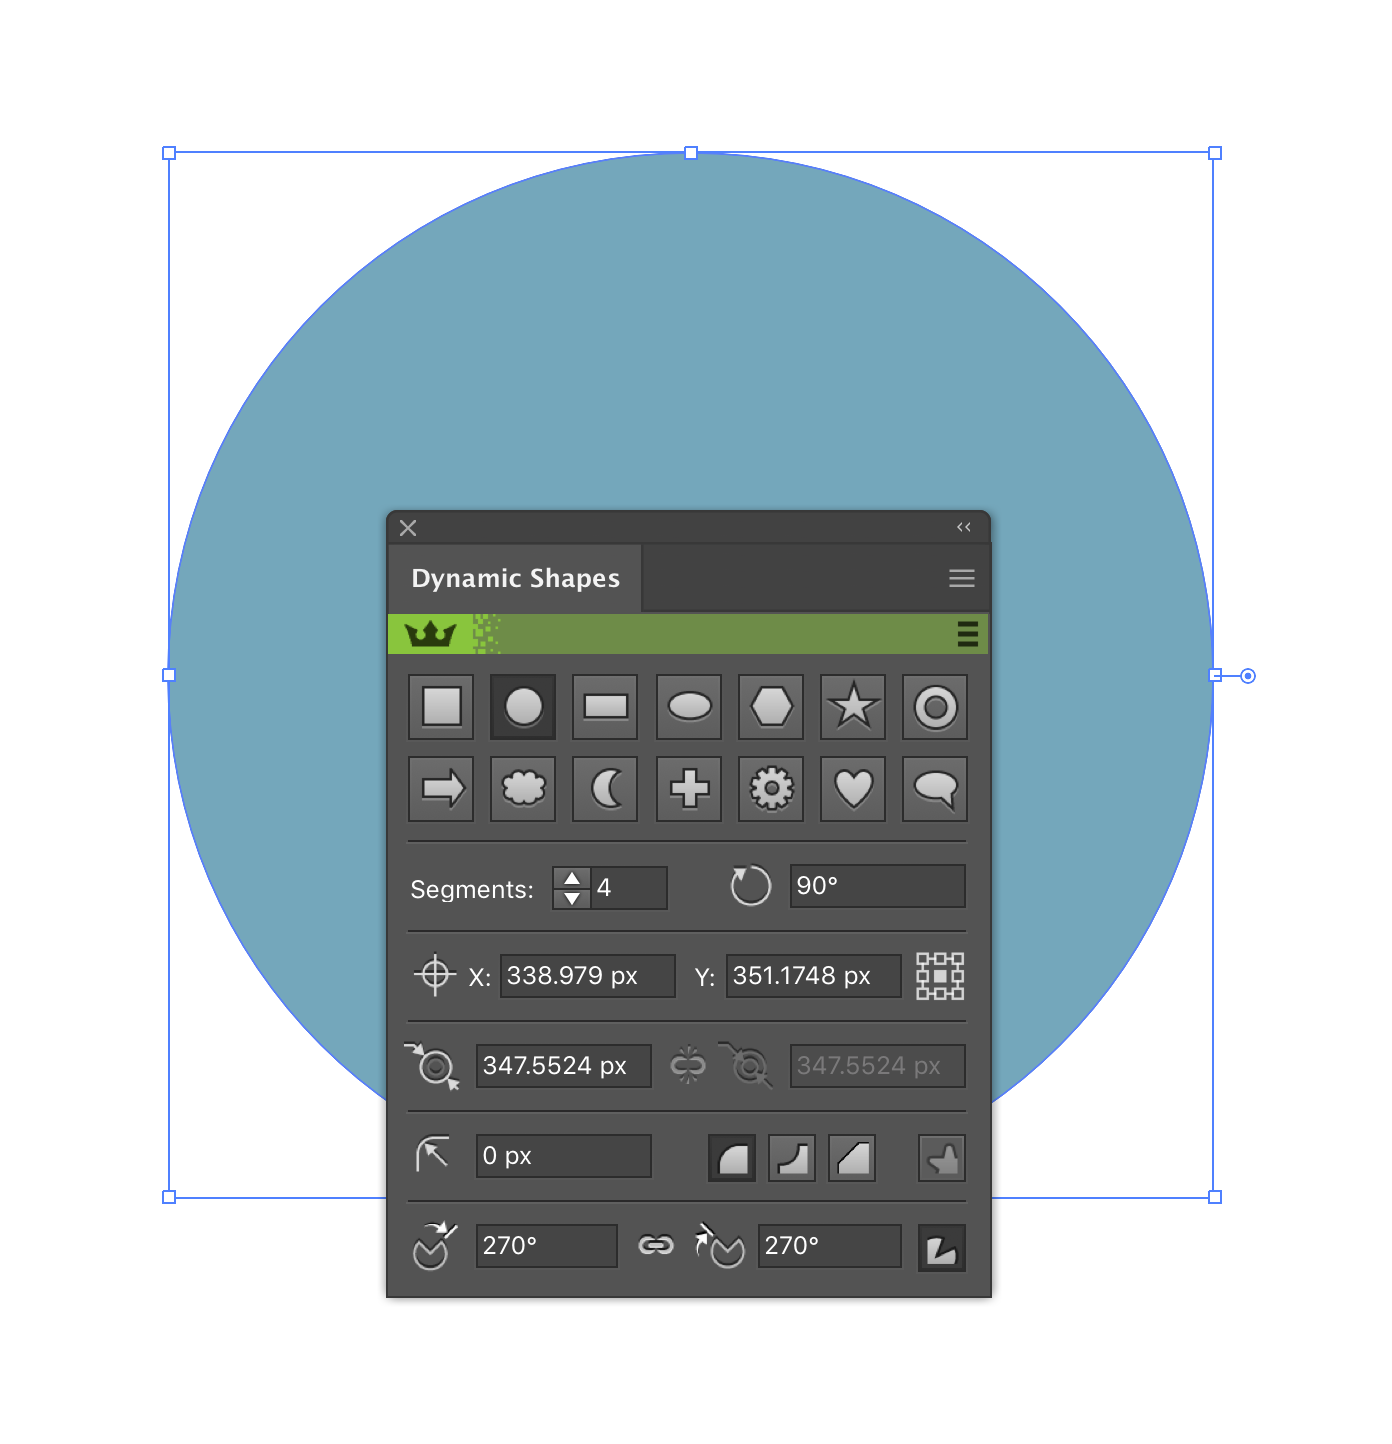
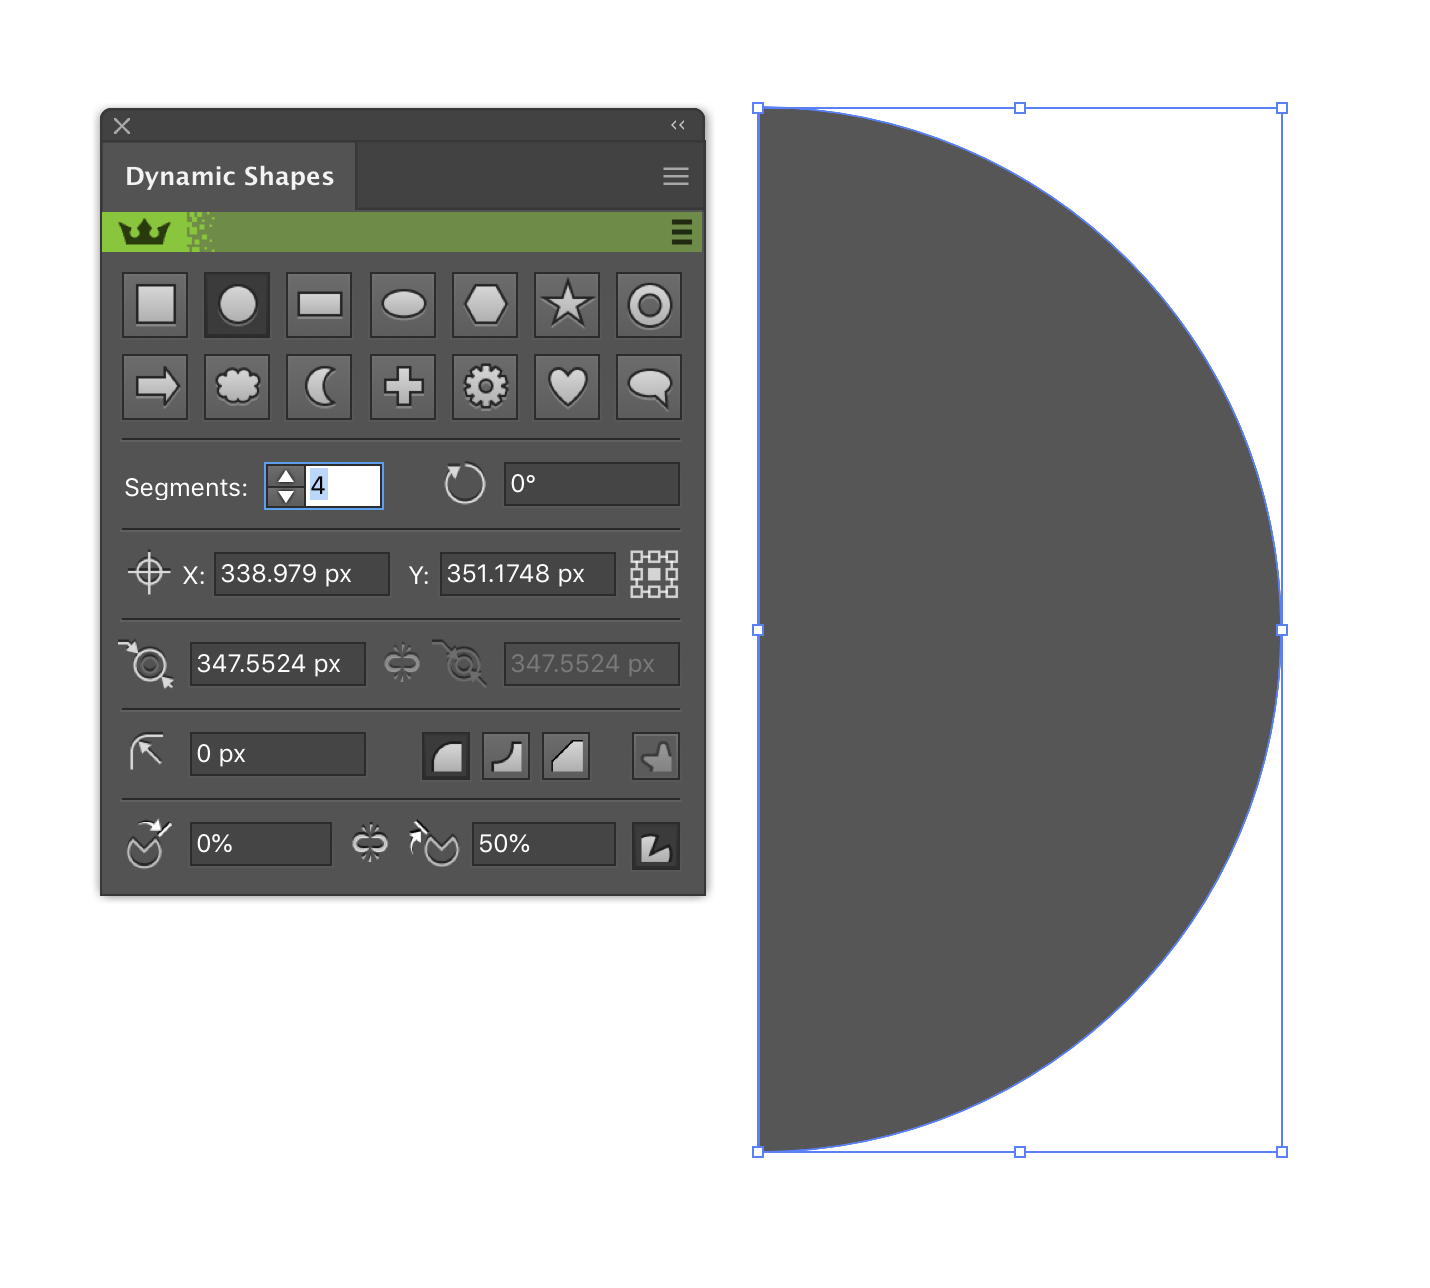
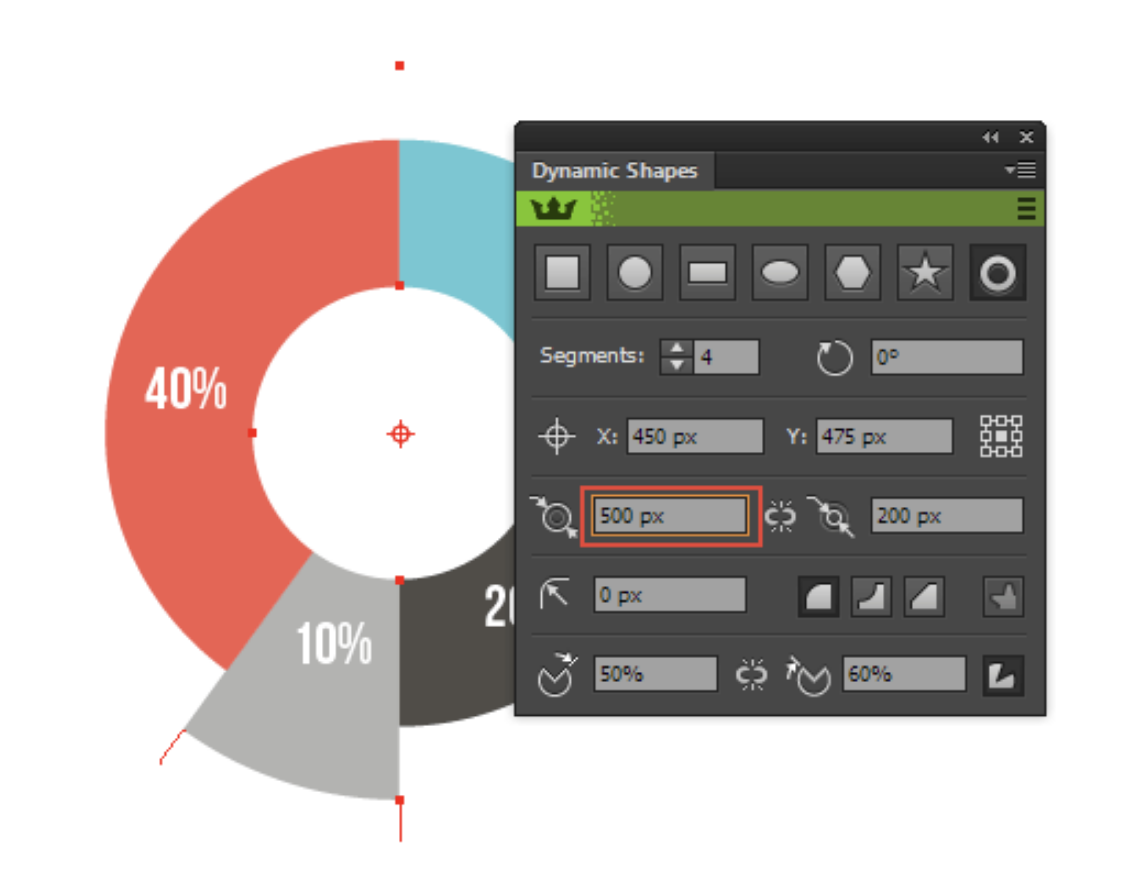
Take Dynamic Shapes Tool and open the Dynamic Shapes panel of VectorScribe plugin (Window> VectorScribe> Dynamic Shapes panel). Select Dynamic Circle in the panel and create a circle.
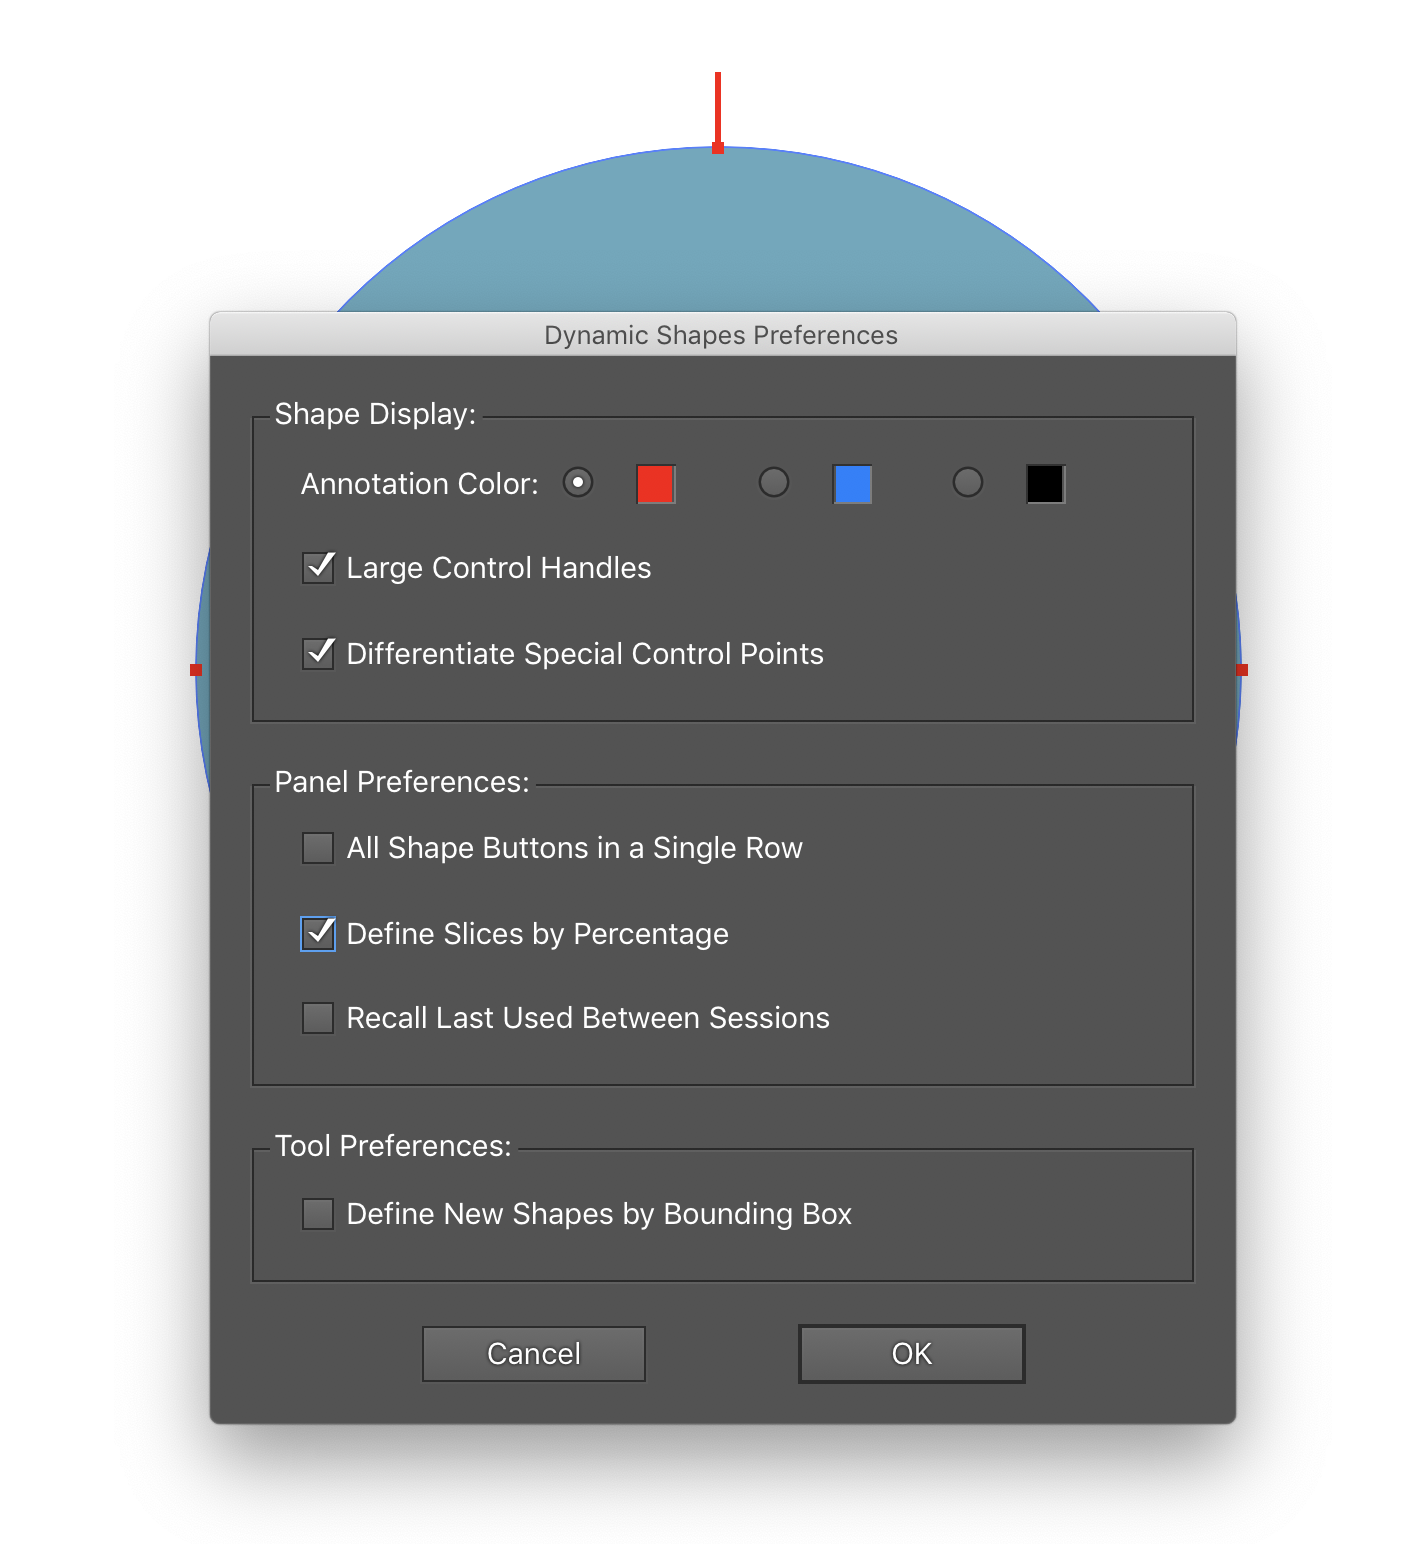
Open the fly-out menu of the Dynamic Shapes panel and click Dynamic Shapes Preferences... Now tick Define Slices by Percentage in the dialog box.
Step 2
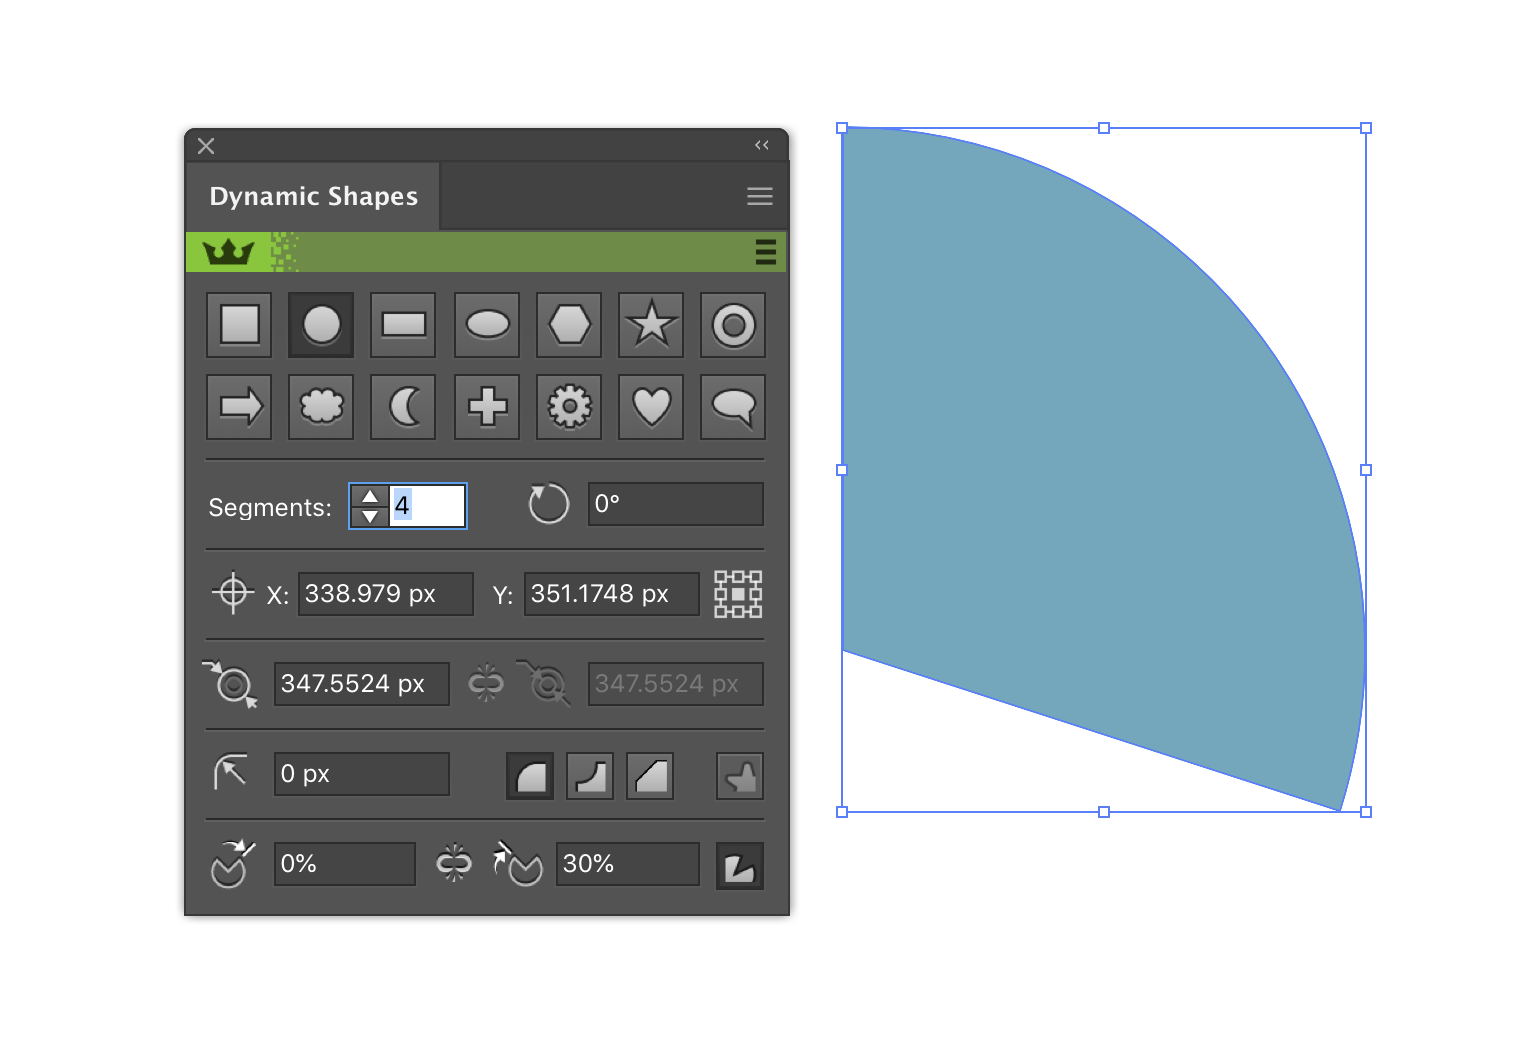
In the numeric field Angle of the end of the sliced shape type value that corresponds to the first sector of the pie chart (30% in my case).
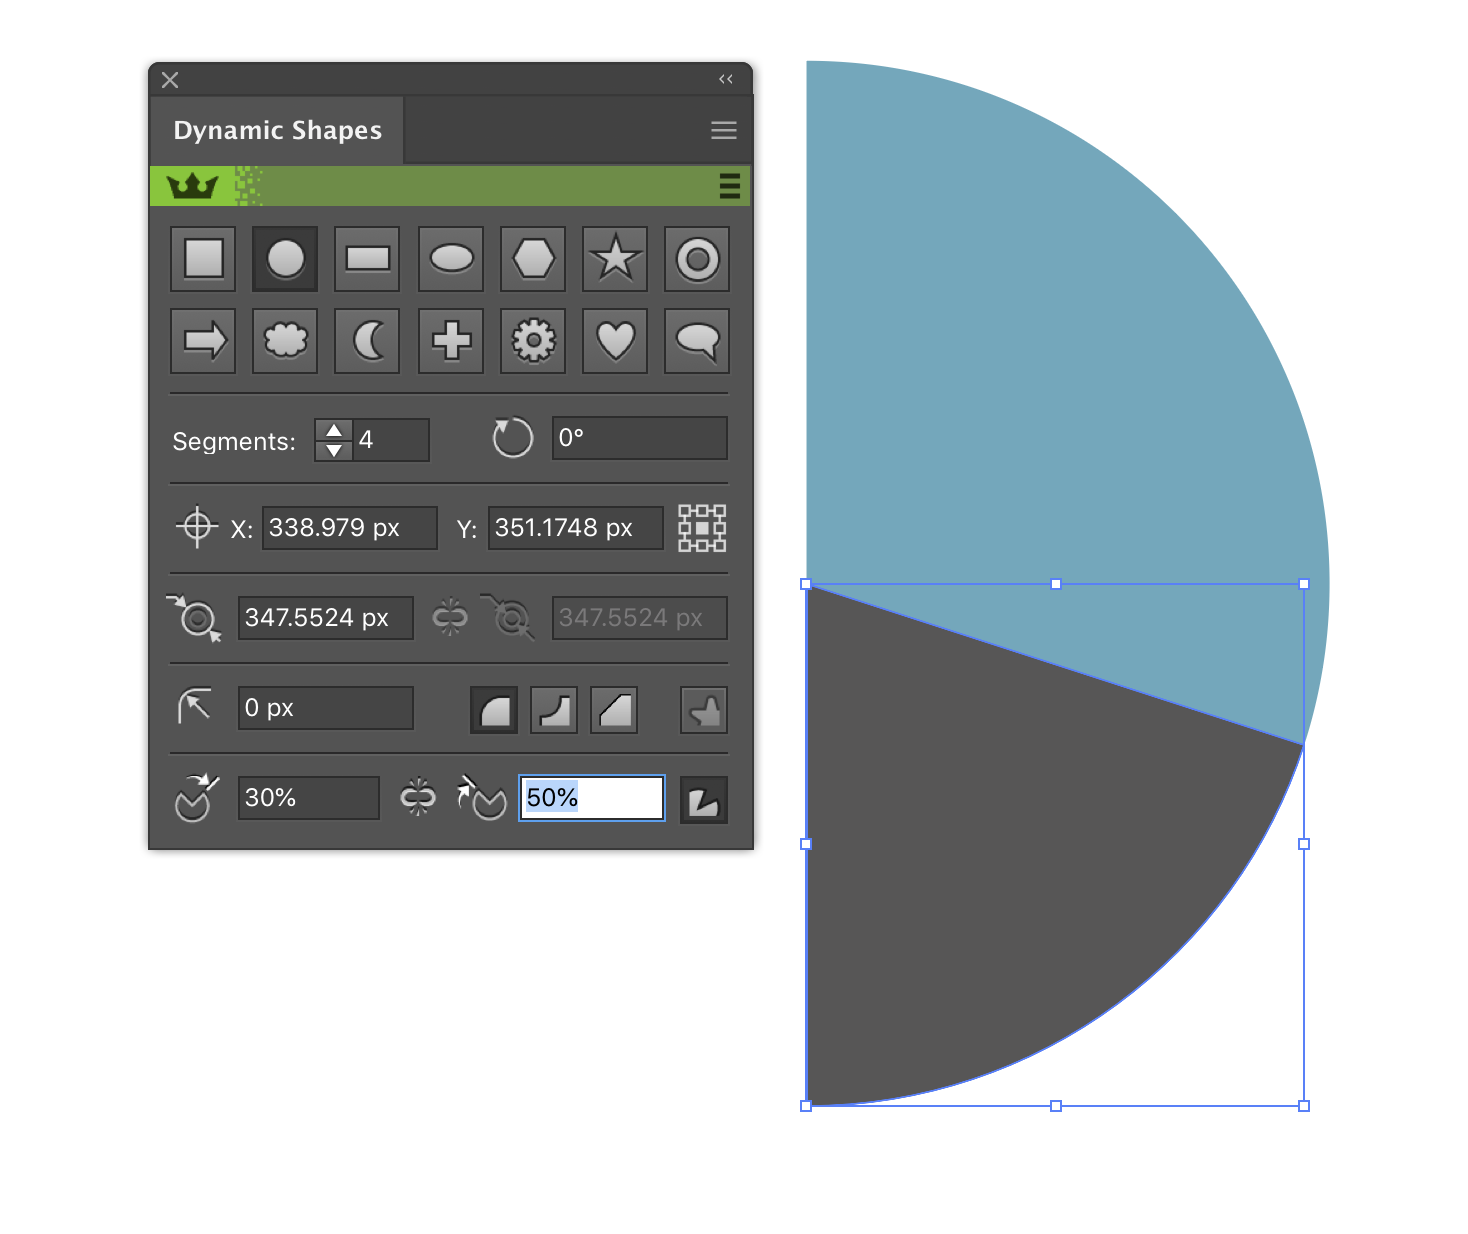
Duplicate the first sector (Cmd / Ctrl + C, Cmd / Ctrl + F) and recolor the new shape in a different color. Assume the second sector corresponds to 20%. Key in 30 + 20 = 50% into the numeric field.
Into the numeric field Angle of the start of the sliced shape type in the previous value of 30%, which corresponds to the end of the first sector.
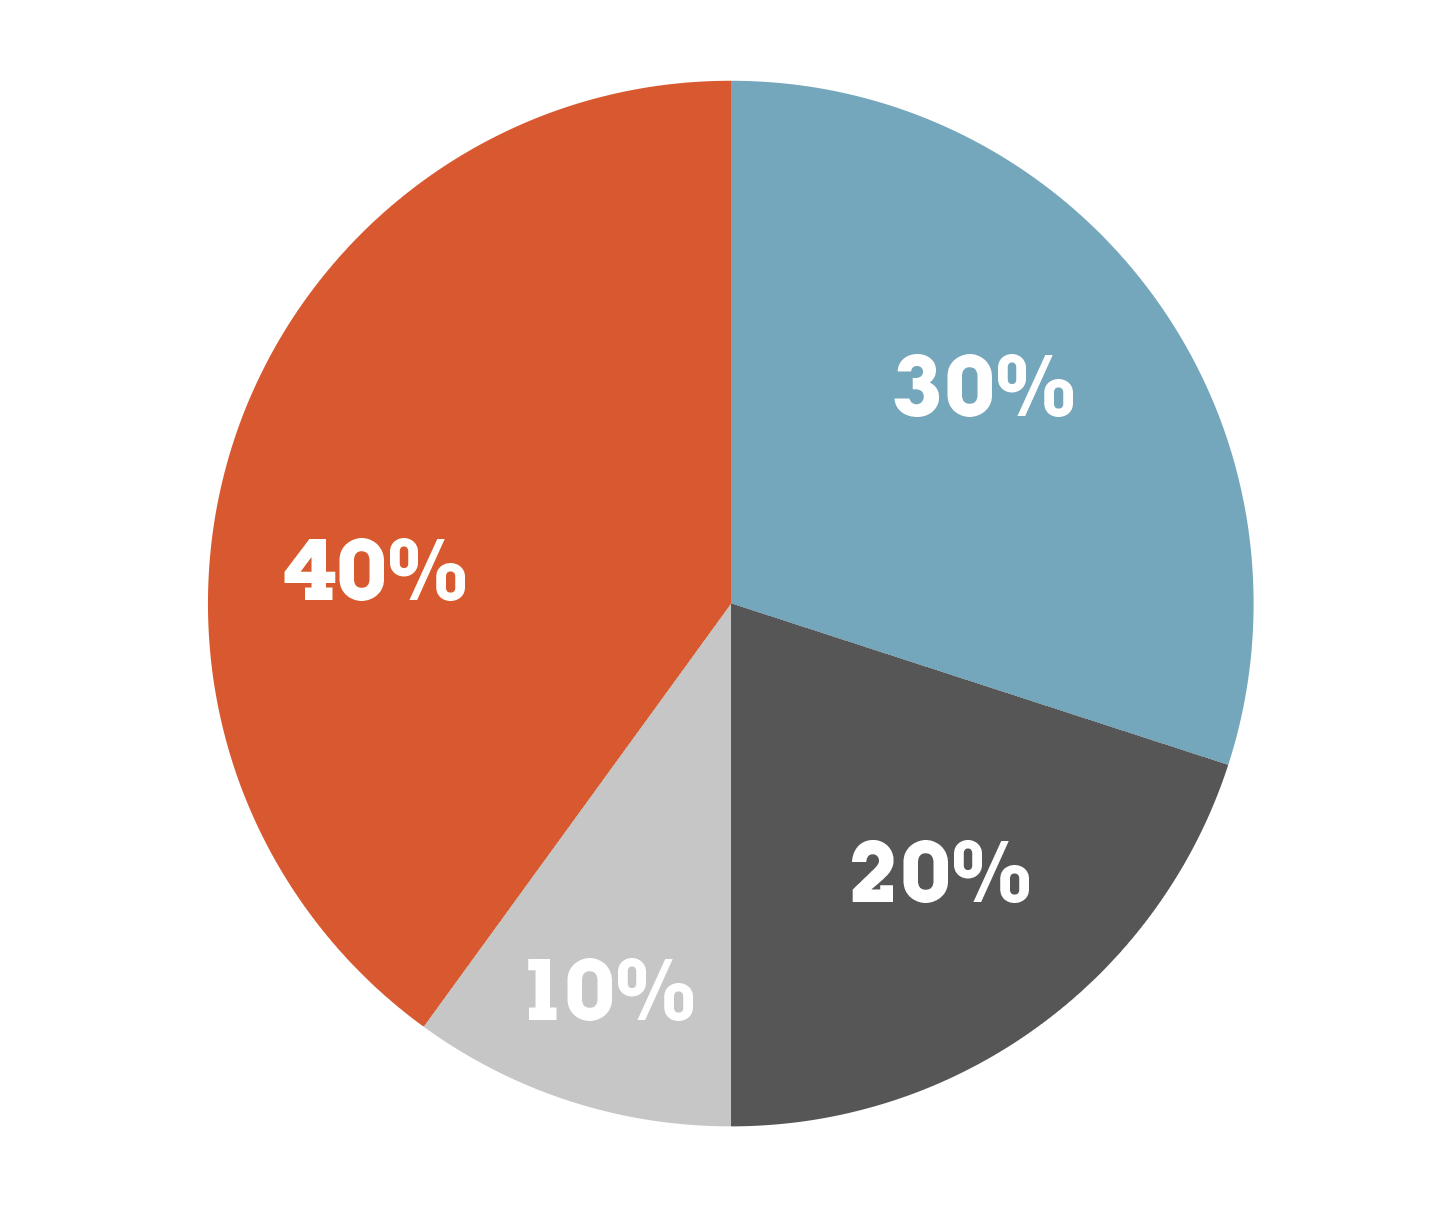
Using this technique, we create the entire pie chart.
Step 3
Unlike traditional vector object sectors of our pie charts are dynamic, which means we can always change the relevant categories in the Dynamic Shapes panel. Or even change the chart type. For example, select all the sectors and click on the Dynamic Donut button.
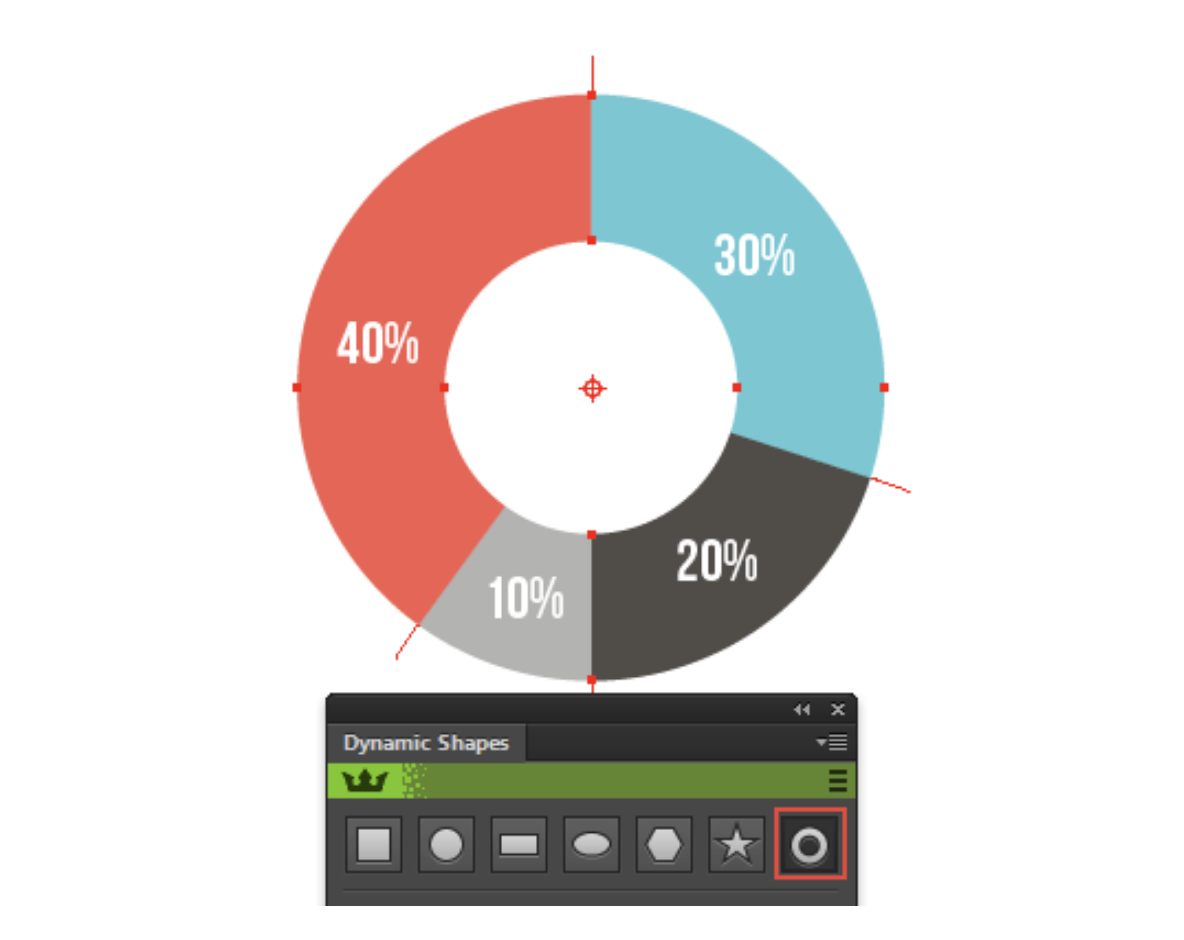
You can also change the outer or inner diameter of some sectors and so on and so forth.
Using Dynamic Shapes in just a few minutes I have created several types of pie charts.
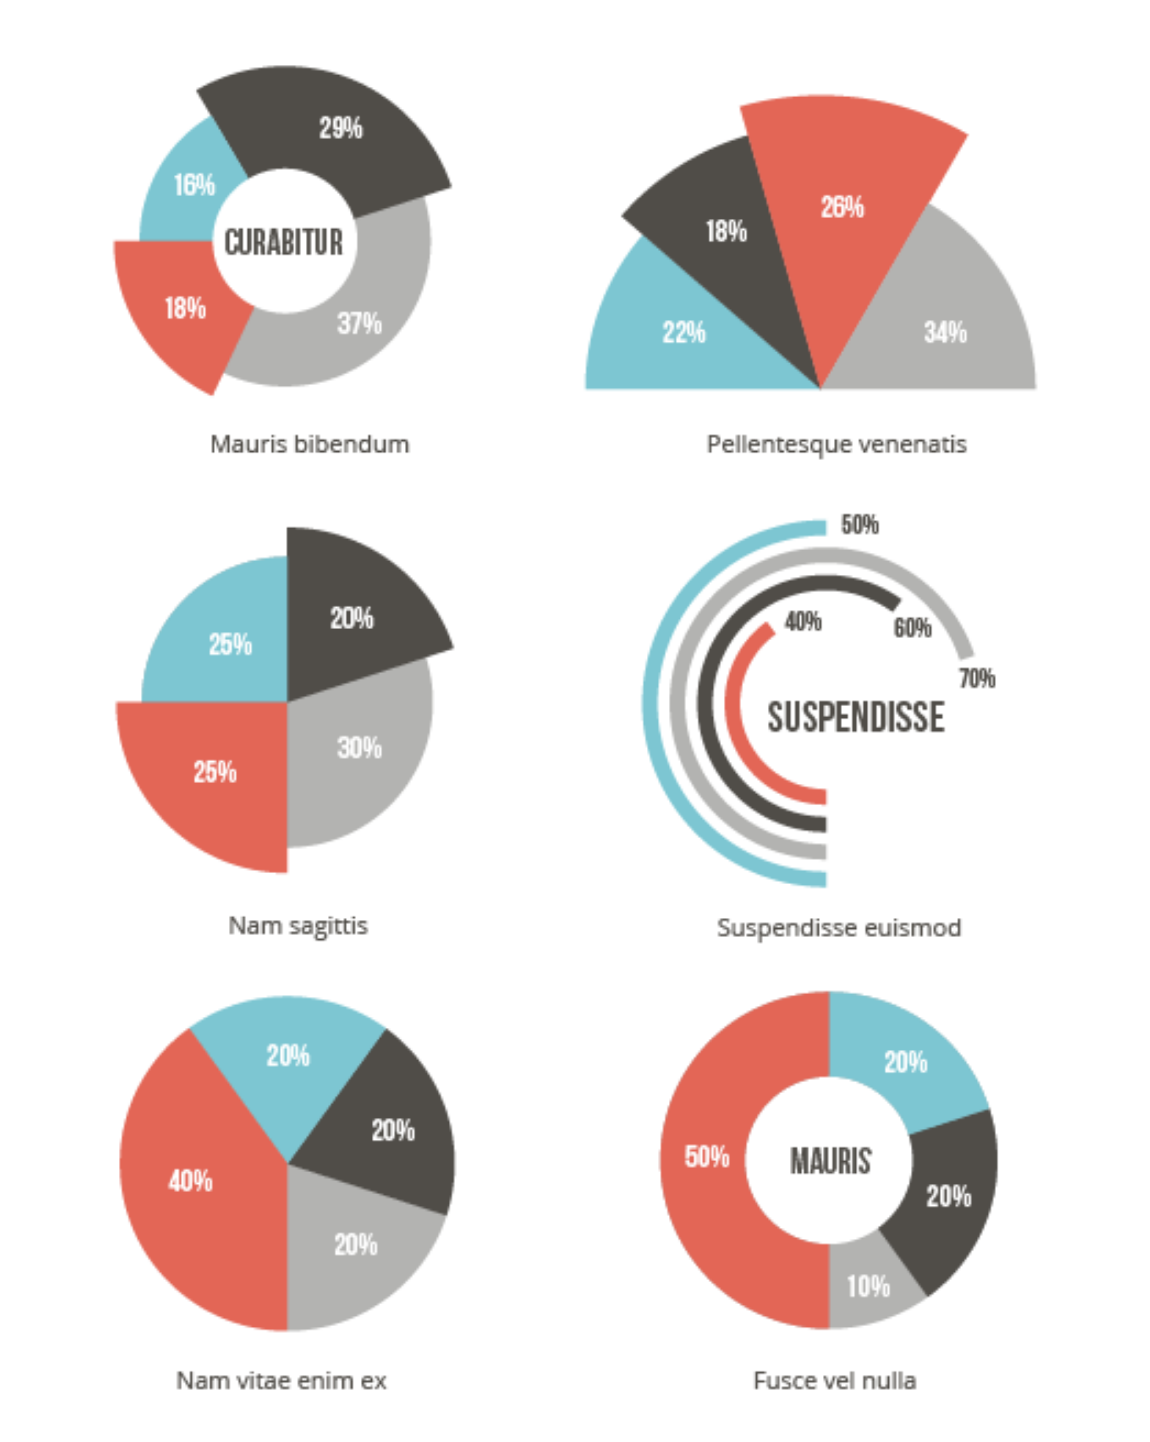
As you can imagine the number of types depends only on your imagination.
Create a column or a bar chart with Extend Path Tool
Step 4
Create a shape that will correspond to the shape of the column of the bar chart. In my case it is a simple pentagonal shape, although you can use more complex graphics. Save an object as an Art Brush. In the Art Brush Option dialog box, select Stretch Between Guides, then shift the right guide that defines the area that will stretch.
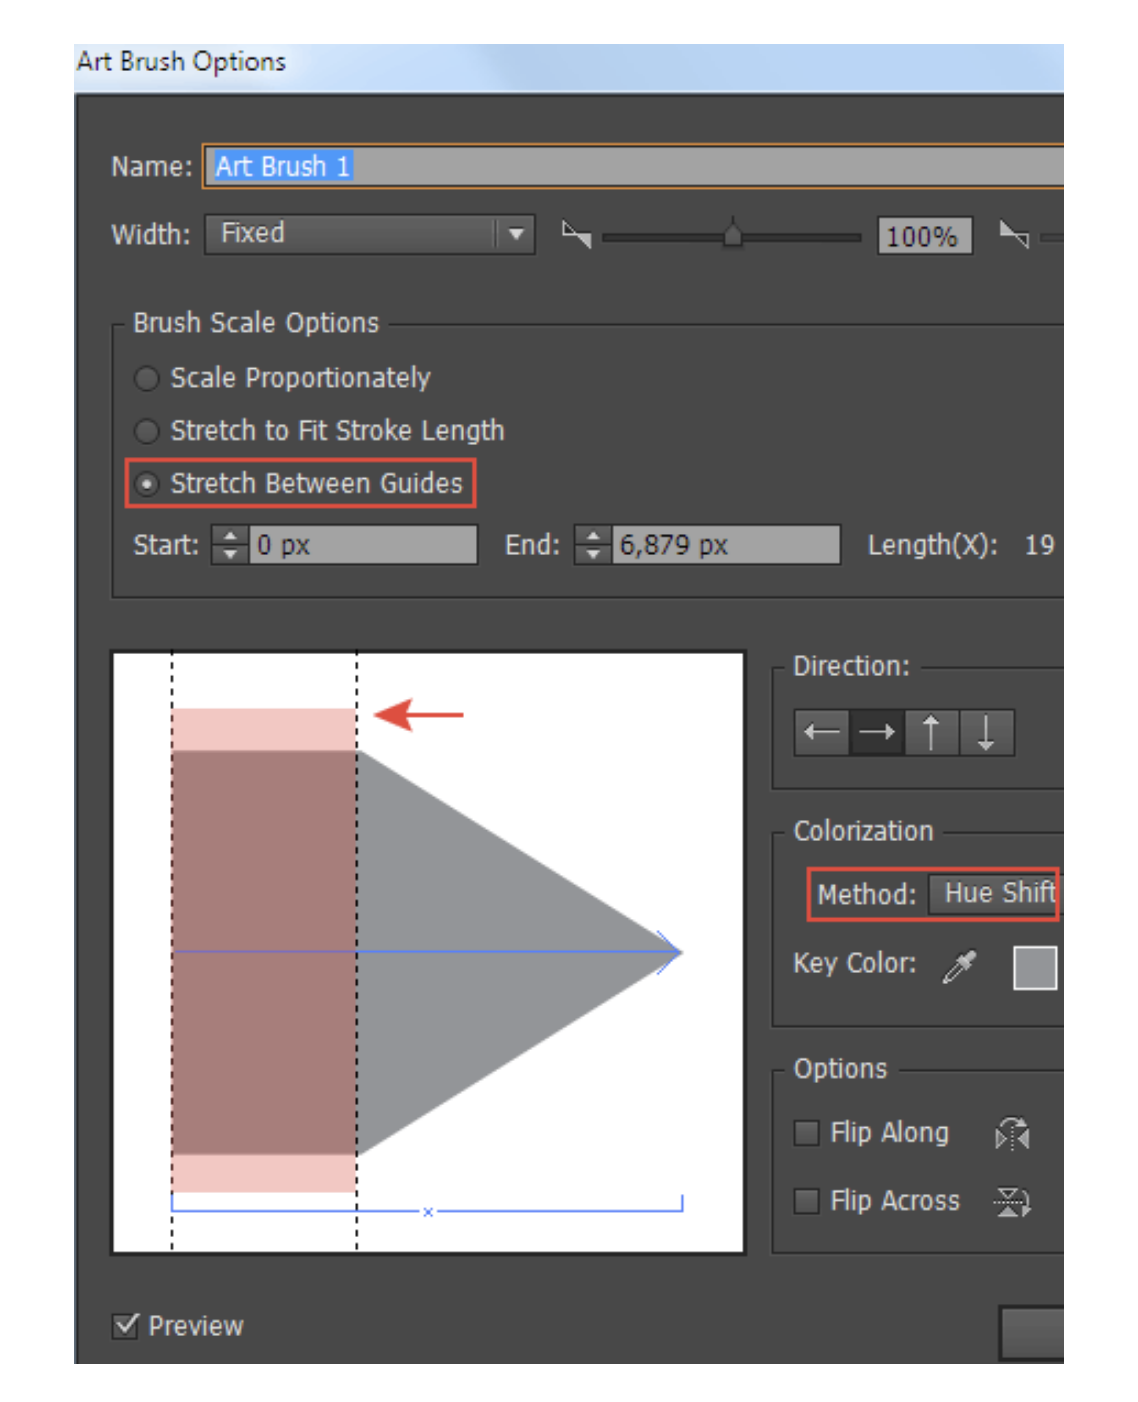
Choose Hue Shift as the colorization method. This will allow us to paint the columns in different colors that match the color of the stroke.
Step 5
Create a series of colored horizontal straight line segments of equal length. Apply the Art Brush to them.

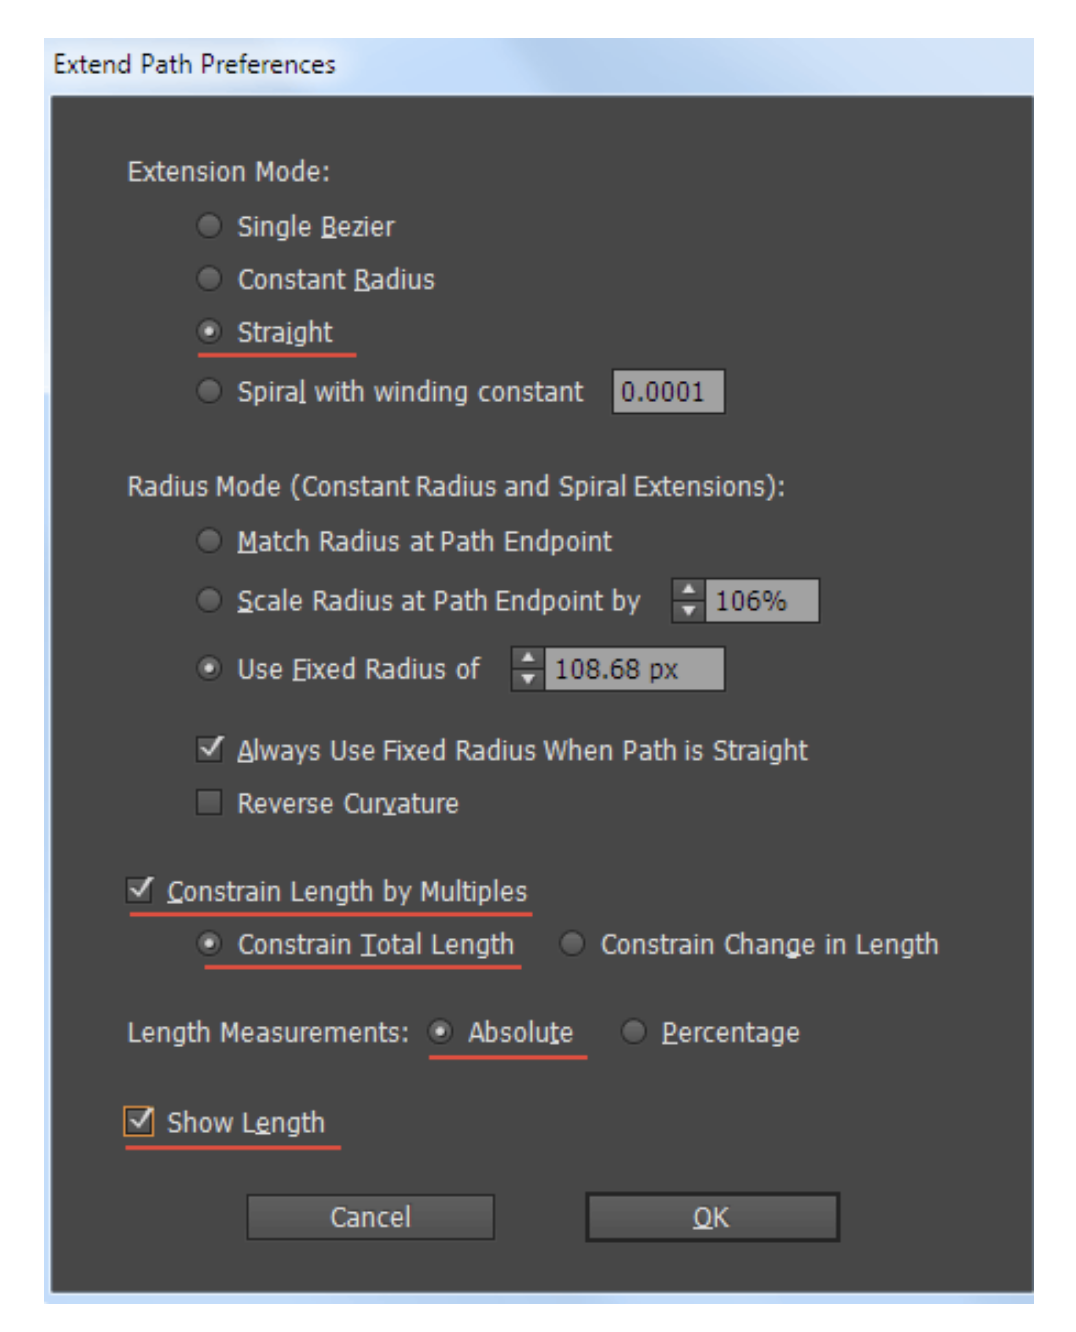
Take Extend Path Tool, then press the Enter / Return key to open the Extend Path Preferences dialog box. Here, choose Extension Mode: Straight, Constrain Length by Multiples, Constrain Total Length and Absolute or Percentage depending on the tasks. In order to see annotation in the process of changing the length, tick Show Length.
Step 6
We can now lengthen the columns with Extend Path Tool, setting the length at a fixed amount in absolute or percentage values.

The length of the column must correspond to the value of a particular category.
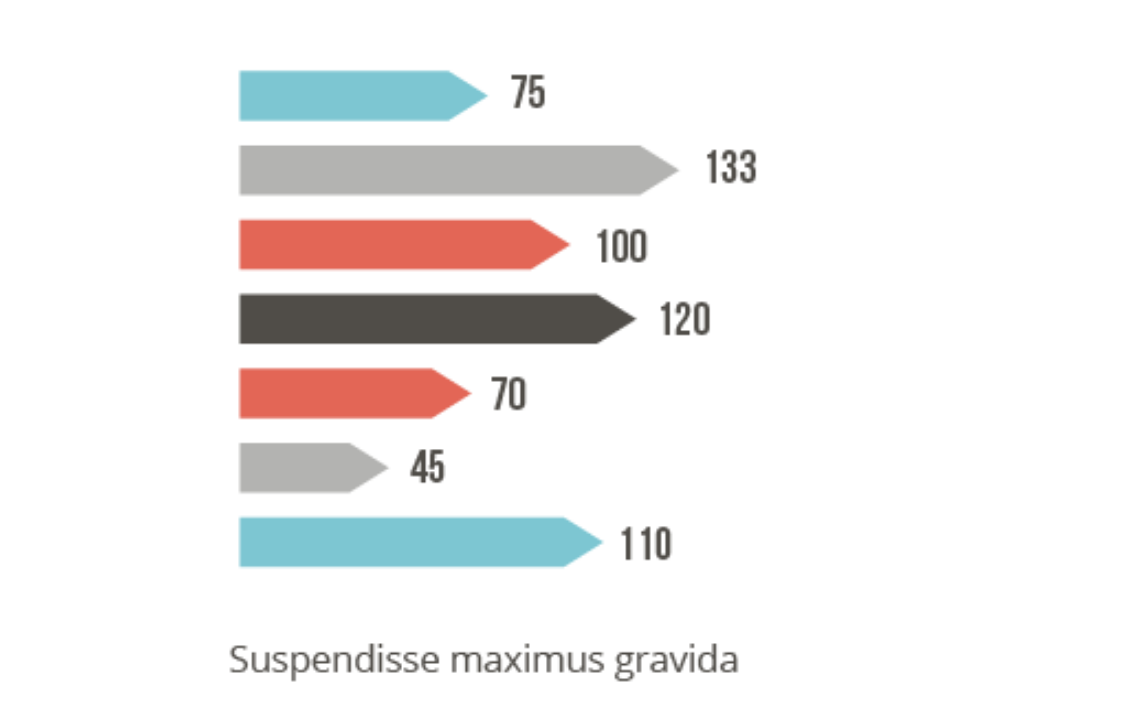
To create a column chart a similar technique is used.

Create line graphs with PathScribe Tool
Step 7
Create multiple horizontal straight line segments that correspond to our categories.

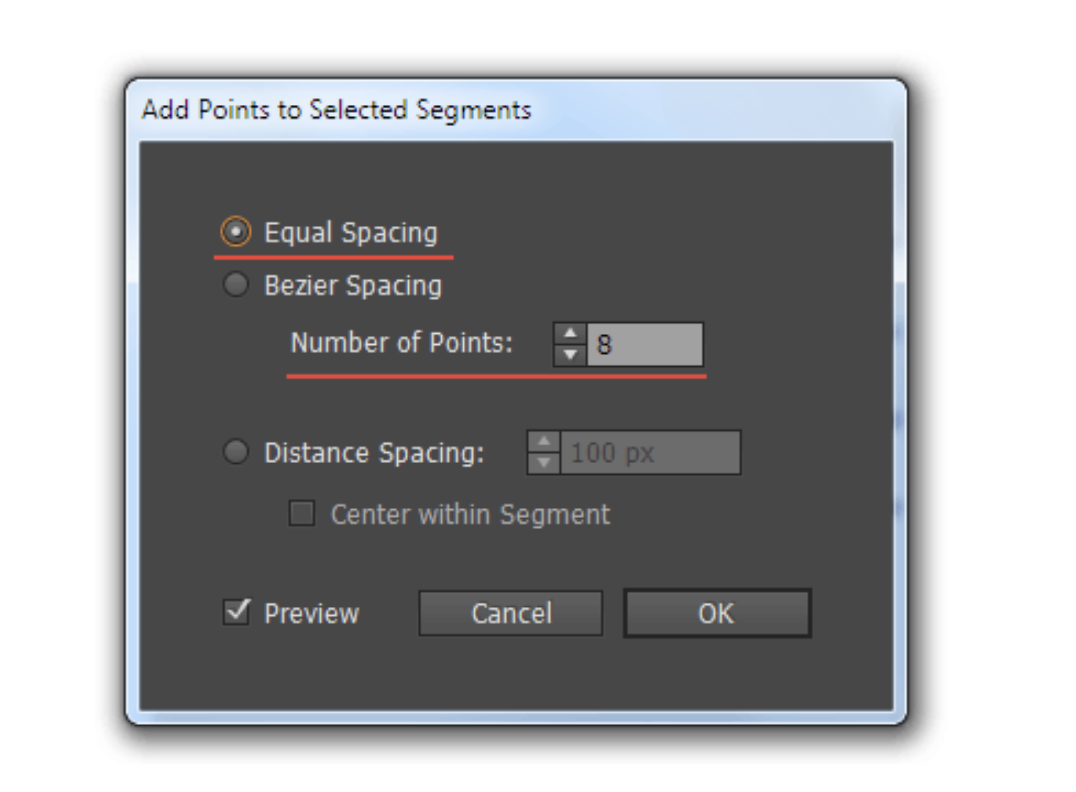
We need to create points on these segments, the number of which will correspond to the number of data categories. PathScribe Tool will help us with this. Take the tool and open its panel (Window> VectorScribe> PathScribe panel). Select all the lines, then select Add Points to Selected Segments … in the fly-out menu of the PathScribe panel. In the open dialog box, select Equal Spacing option and set the Number of Points, that equals the number of data categories minus 2 (the start and end point of the segment).
We can shift the points in the vertical direction in accordance with the existing data sets.
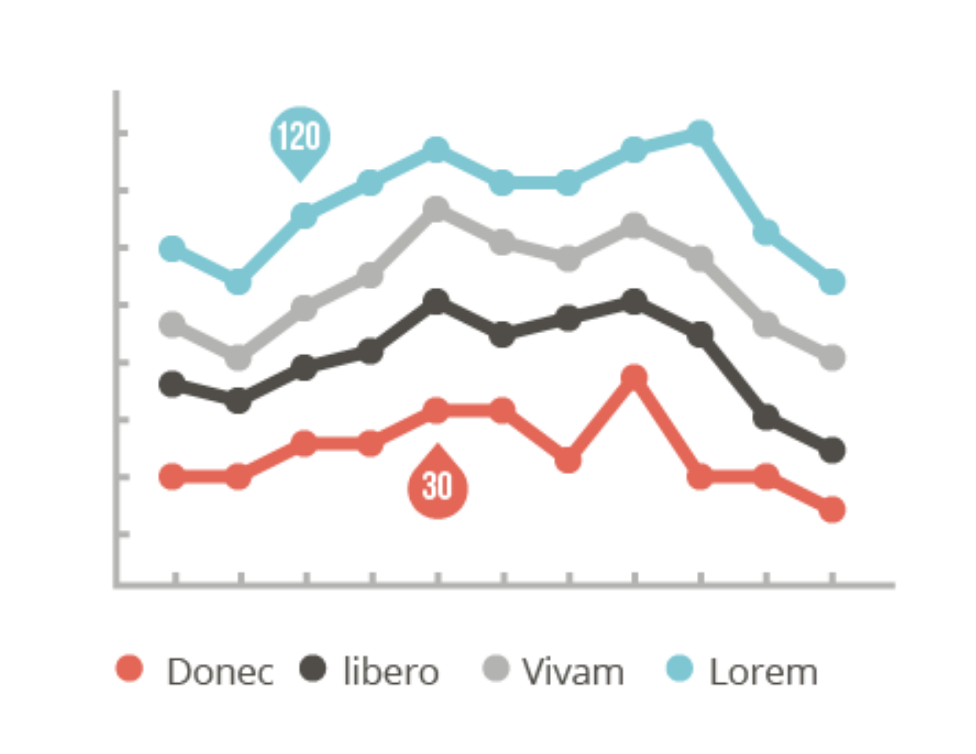
The Infographics template with Dynamic Graphs is ready.